Edit chart
Loading graph
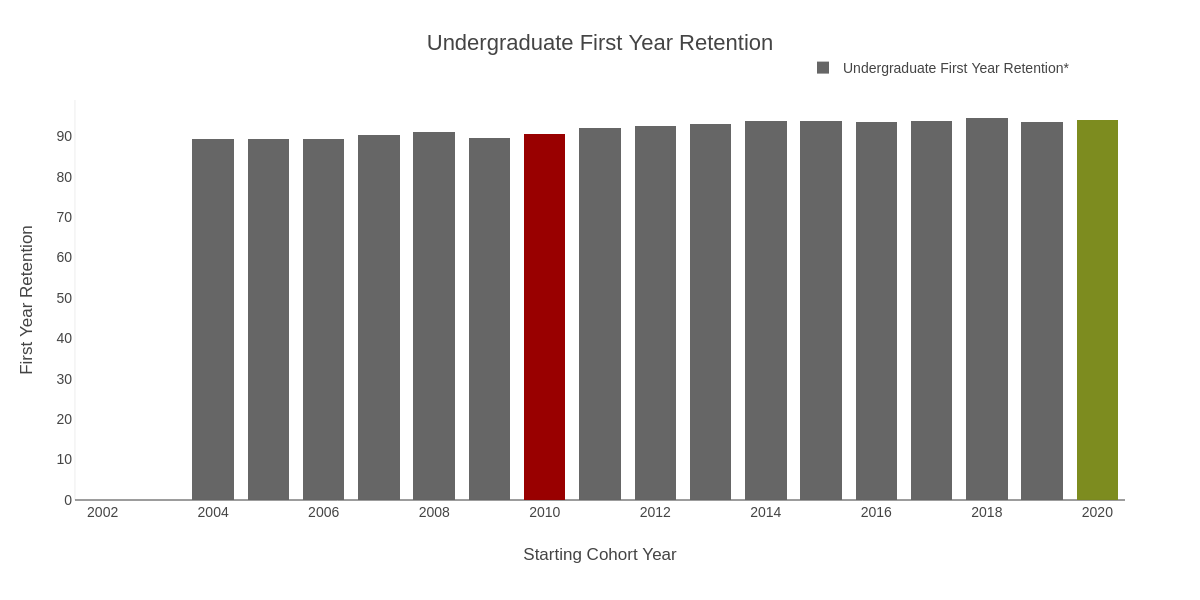
Provostncstate's interactive graph and data of "Undergraduate First Year Retention" is a stacked bar chart, showing Undergraduate First Year Retention*, Baseline, Goal; with Starting Cohort Year in the x-axis and First Year Retention in the y-axis.. The x-axis shows values from 2001.5 to 2020.5. The y-axis shows values from 0 to 98.94736842105264. This visualization has the following annotation: *Data is shown by cohort year.